import pandas as pdimport numpy as npimport seaborn as snsimport torchimport torch.nn as nnimport torch.nn.functional as Ffrom torch.utils.data import DataLoaderfrom torch.utils.data import TensorDatasetimport matplotlib.pyplot as pltfrom sklearn.model_selection import train_test_splitfrom sklearn.metrics import accuracy_score, confusion_matrix, classification_reportfrom sklearn.preprocessing import StandardScaler# set default figure sizeplt.rcParams['figure.figsize'] = (15, 7.0)
heart_data = '../input/heart-attack-analysis-prediction-dataset/heart.csv'heart_df = pd.read_csv(heart_data)heart_df.head()
age sex cp trtbps chol fbs restecg thalachh exng oldpeak slp caa thall output
0 63 1 3 145 233 1 0 150 0 2.3 0 0 1 1
1 37 1 2 130 250 0 1 187 0 3.5 0 0 2 1
2 41 0 1 130 204 0 0 172 0 1.4 2 0 2 1
3 56 1 1 120 236 0 1 178 0 0.8 2 0 2 1
4 57 0 0 120 354 0 1 163 1 0.6 2 0 2 1
# describe the dataheart_df.describe()
age sex cp trtbps chol fbs restecg thalachh exng oldpeak slp caa thall output
count 303.000000 303.000000 303.000000 303.000000 303.000000 303.000000 303.000000 303.000000 303.000000 303.000000 303.000000 303.000000 303.000000 303.000000
mean 54.366337 0.683168 0.966997 131.623762 246.264026 0.148515 0.528053 149.646865 0.326733 1.039604 1.399340 0.729373 2.313531 0.544554
std 9.082101 0.466011 1.032052 17.538143 51.830751 0.356198 0.525860 22.905161 0.469794 1.161075 0.616226 1.022606 0.612277 0.498835
min 29.000000 0.000000 0.000000 94.000000 126.000000 0.000000 0.000000 71.000000 0.000000 0.000000 0.000000 0.000000 0.000000 0.000000
25% 47.500000 0.000000 0.000000 120.000000 211.000000 0.000000 0.000000 133.500000 0.000000 0.000000 1.000000 0.000000 2.000000 0.000000
50% 55.000000 1.000000 1.000000 130.000000 240.000000 0.000000 1.000000 153.000000 0.000000 0.800000 1.000000 0.000000 2.000000 1.000000
75% 61.000000 1.000000 2.000000 140.000000 274.500000 0.000000 1.000000 166.000000 1.000000 1.600000 2.000000 1.000000 3.000000 1.000000
max 77.000000 1.000000 3.000000 200.000000 564.000000 1.000000 2.000000 202.000000 1.000000 6.200000 2.000000 4.000000 3.000000 1.000000
# checking data typesheart_df.dtypes
age           int64sex           int64cp            int64trtbps        int64chol          int64fbs           int64restecg       int64thalachh      int64exng          int64oldpeak     float64slp           int64caa           int64thall         int64output        int64dtype: object
# drop duplicates if anyheart_df.drop_duplicates()# check missing valusheart_df.isna().sum()
age         0sex         0cp          0trtbps      0chol        0fbs         0restecg     0thalachh    0exng        0oldpeak     0slp         0caa         0thall       0output      0dtype: int64
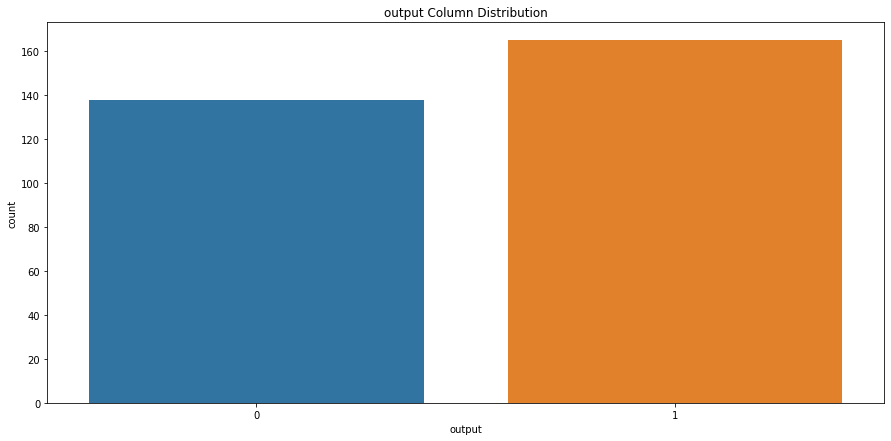
# check output column class distributionsns.countplot(x='output', data=heart_df).set_title("output Column Distribution")
Text(0.5, 1.0, 'output Column Distribution')

png

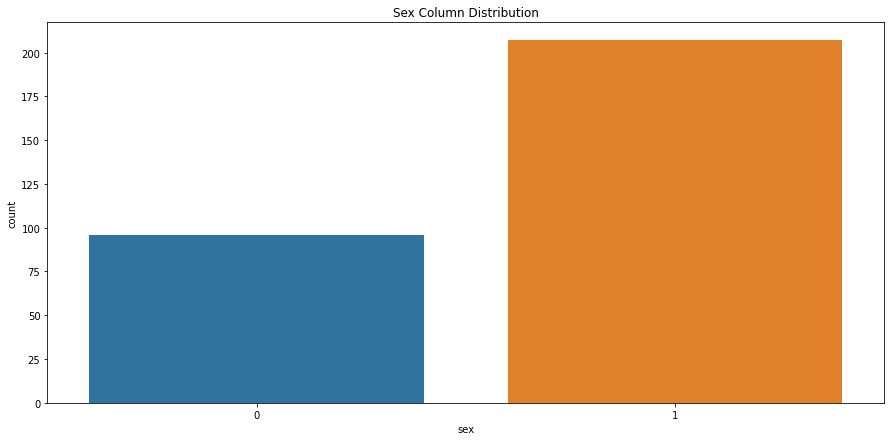
# check sex column class distributionsns.countplot(x='sex', data=heart_df).set_title("Sex Column Distribution")
Text(0.5, 1.0, 'Sex Column Distribution')

png

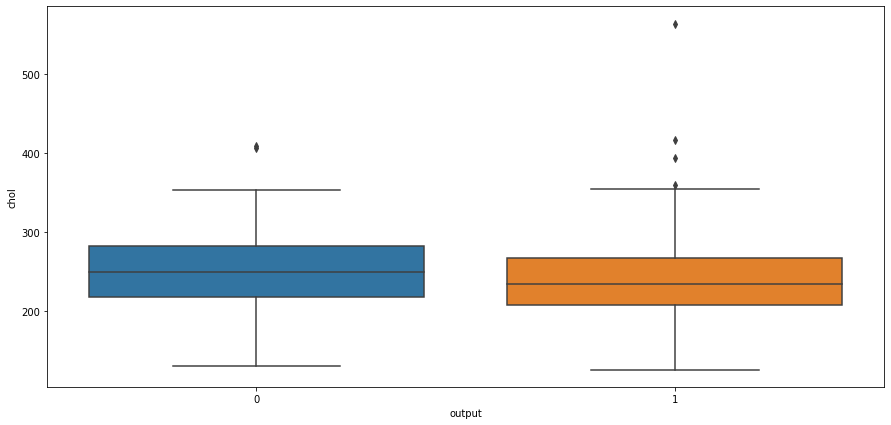
# box plot for output and cholestrol levelsns.boxplot(x="output",y="chol",data=heart_df)
<AxesSubplot:xlabel='output', ylabel='chol'>

png

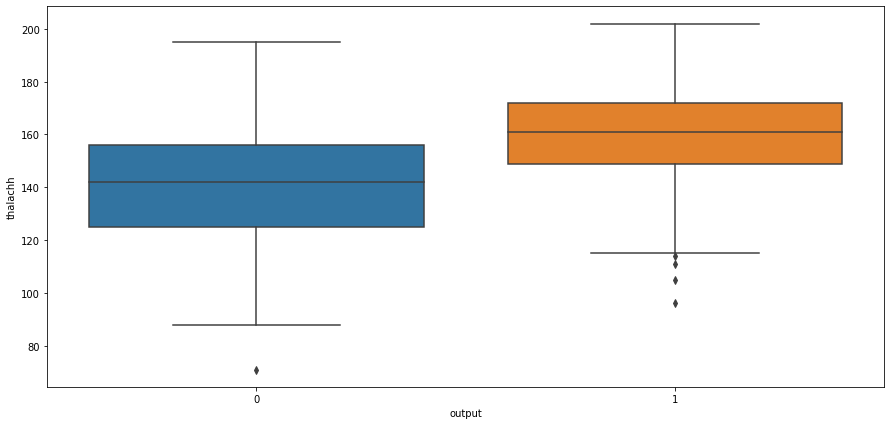
# box plot for output and cholestrol levelsns.boxplot(x="output",y="thalachh",data=heart_df)
<AxesSubplot:xlabel='output', ylabel='thalachh'>

png

# box plot for output and cholestrol levelsns.boxplot(x="output",y="oldpeak",data=heart_df)
<AxesSubplot:xlabel='output', ylabel='oldpeak'>

png

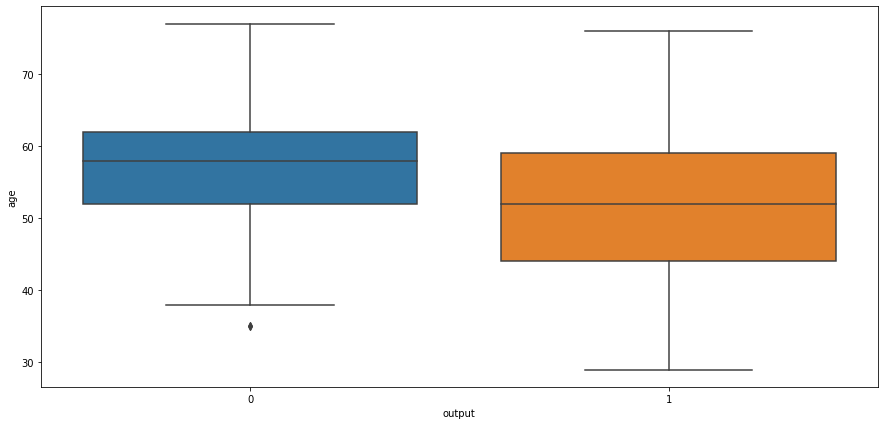
# box plot for output and cholestrol levelsns.boxplot(x="output",y="age",data=heart_df)
<AxesSubplot:xlabel='output', ylabel='age'>

png

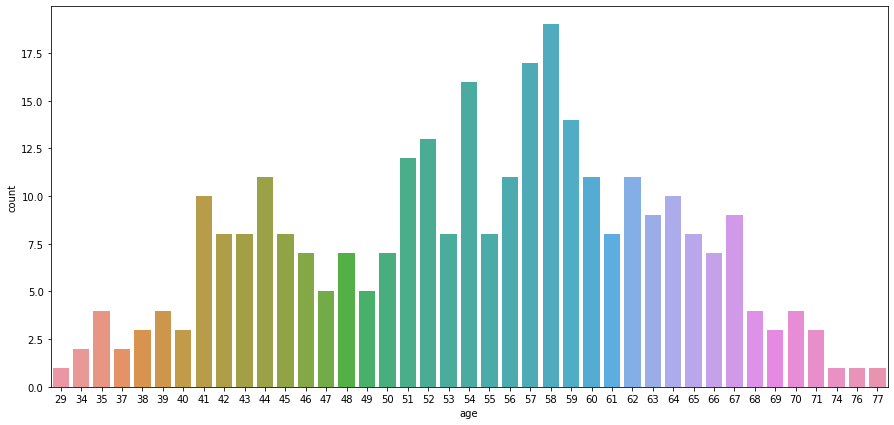
ax = sns.countplot(x='age', data=heart_df)

png

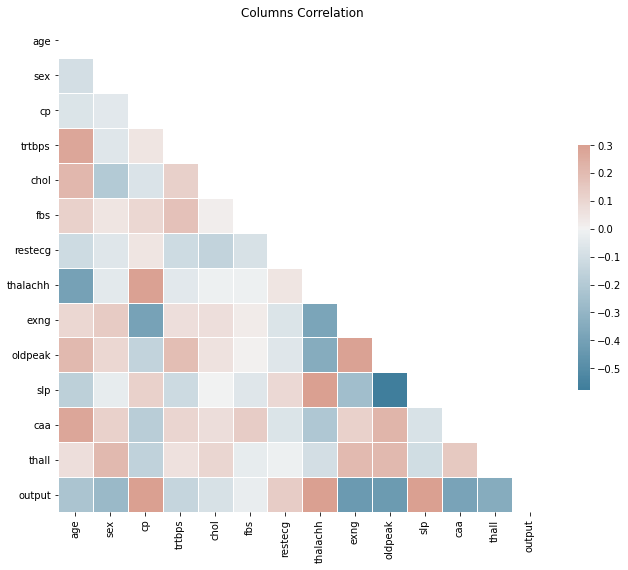
# check correlationcorr = heart_df.corr()# Generate a mask for the upper trianglemask = np.triu(np.ones_like(corr, dtype=bool))# Set up the matplotlib figuref, ax = plt.subplots(figsize=(11, 9))# Generate a custom diverging colormapcmap = sns.diverging_palette(230, 20, as_cmap=True)# Draw the heatmap with the mask and correct aspect ratiosns.heatmap(corr, mask=mask, cmap=cmap, vmax=.3, center=0,            square=True, linewidths=.5, cbar_kws={"shrink": .5}).set_title("Columns Correlation")
Text(0.5, 1.0, 'Columns Correlation')

png

# split data for trainingy = heart_df.output.to_numpy()X = heart_df.drop('output', axis=1).to_numpy()# scale X valuesscaler = StandardScaler()X = scaler.fit_transform(X)# split data while keeping output class distribution consistentX_train, X_test, y_train, y_test = train_test_split(X, y, test_size=0.2, stratify=y)
# convert data to pytorch tensorsdef df_to_tensor(df):    return torch.from_numpy(df).float()X_traint = df_to_tensor(X_train)y_traint = df_to_tensor(y_train)X_testt = df_to_tensor(X_test)y_testt = df_to_tensor(y_test)
# create pytorch datasettrain_ds = TensorDataset(X_traint, y_traint)test_ds = TensorDataset(X_testt, y_testt)# create data loadersbatch_size = 5train_dl = DataLoader(train_ds, batch_size, shuffle=True)test_dl = DataLoader(test_ds, batch_size, shuffle=False)
# model architectureclass BinaryNetwork(nn.Module):    def __init__(self, input_size, output_size):        super().__init__()        self.l1 = nn.Linear(input_size, 64)        self.l2 = nn.Linear(64, 32)        self.l3 = nn.Linear(32, 16)        self.out = nn.Linear(16, output_size)    def forward(self, x):        x = self.l1(x)        x = F.relu(x)        x = self.l2(x)        x = F.relu(x)        x = self.l3(x)        x = F.relu(x)        x = self.out(x)        return torch.sigmoid(x) # scaling values between 0 and 1
input_size = 13 # number of featuresoutput_size = 1model = BinaryNetwork(input_size, output_size)loss_fn = nn.BCELoss() # Binary Cross Entropyoptim = torch.optim.Adam(model.parameters(), lr=1e-3)model
BinaryNetwork(  (l1): Linear(in_features=13, out_features=64, bias=True)  (l2): Linear(in_features=64, out_features=32, bias=True)  (l3): Linear(in_features=32, out_features=16, bias=True)  (out): Linear(in_features=16, out_features=1, bias=True))
epochs = 100losses = []for i in range(epochs):    epoch_loss = 0    for feat, target in train_dl:        optim.zero_grad()        out = model(feat)        loss = loss_fn(out, target.unsqueeze(1))        epoch_loss += loss.item()        loss.backward()        optim.step()    losses.append(epoch_loss)    # print loss every 10    if i % 10 == 0:        print(f"Epoch: {i}/{epochs}, Loss = {loss:.5f}")
Epoch: 0/100, Loss = 0.79641Epoch: 10/100, Loss = 0.03637Epoch: 20/100, Loss = 0.07704Epoch: 30/100, Loss = 0.02023Epoch: 40/100, Loss = 0.00084Epoch: 50/100, Loss = 0.00000Epoch: 60/100, Loss = 0.00001Epoch: 70/100, Loss = 0.00000Epoch: 80/100, Loss = 0.00018Epoch: 90/100, Loss = 0.00029
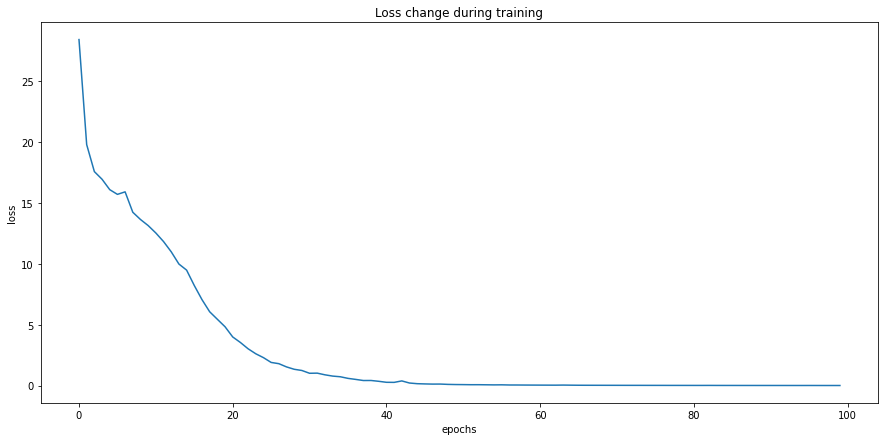
# plot lossesgraph = sns.lineplot(x=[x for x in range(0, epochs)], y=losses)graph.set(title="Loss change during training", xlabel='epochs', ylabel='loss')plt.show()

png

# evaluate the modely_pred_list = []model.eval()with torch.no_grad():    for X, y in test_dl:        y_test_pred = model(X)        y_pred_tag = torch.round(y_test_pred)        y_pred_list.append(y_pred_tag)# convert predictions to a list of tensors with 1 dimentiony_pred_list = [a.squeeze() for a in y_pred_list]
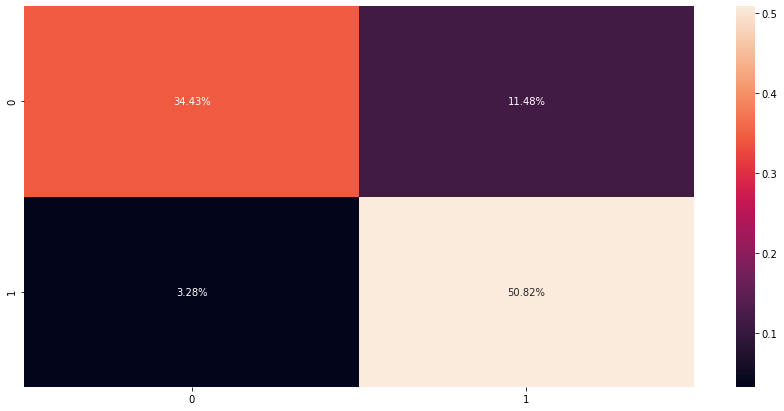
# check confusion matrix (hstack will merge all tensor lists into one list)cfm = confusion_matrix(y_test, torch.hstack(y_pred_list))sns.heatmap(cfm / np.sum(cfm), annot=True, fmt='.2%')
<AxesSubplot:>

png

# print metricsprint(classification_report(y_test, torch.hstack(y_pred_list)))
              precision    recall  f1-score   support           0       0.91      0.75      0.82        28           1       0.82      0.94      0.87        33    accuracy                           0.85        61   macro avg       0.86      0.84      0.85        61weighted avg       0.86      0.85      0.85        61