knowledge Graphs are a way to visualize relationships between entities, they can be helpful in visualizing a relationship and making it simpler to understand.
the data used is collection of sentences extracted from wikipedia.
import reimport pandas as pdimport spacyfrom spacy import displacynlp = spacy.load('en_core_web_sm')from spacy.matcher import Matcherimport networkx as nximport matplotlib.pyplot as pltfrom tqdm import tqdmpd.set_option('display.max_colwidth', 200)%matplotlib inlinedf = pd.read_csv("https://raw.githubusercontent.com/phgunawan/Latihan-ML/master/wiki_sentences_v2.csv")df| sentence | |
|---|---|
| 0 | confused and frustrated, connie decides to leave on her own. |
| 1 | later, a woman’s scream is heard in the distance. |
| 2 | christian is then paralyzed by an elder. |
| 3 | the temple is set on fire. |
| 4 | outside, the cult wails with him. |
| ... | ... |
| 4313 | confidencial also responded negatively, calling the film a barren drama, unsubtle and self-indulgent. |
| 4314 | and le parisien gave the film their highest five-star rating. |
| 4315 | the museum collection includes 37,000 film titles, 60,000 posters, 700,000 photographs and 20,000 books. |
| 4316 | its predecessor was the dutch historical film archive, founded in 1946. |
| 4317 | , 1920'sfilmstar greta garbo by alexander binder, |
4318 rows × 1 columns
# detect dependenciesdoc = nlp(df['sentence'][0])print(f"{'Token':20}Dependency")print('=' * 30)for token in doc: print(f"{token.text:20}{token.dep_}")Token Dependency==============================confused advcland ccfrustrated conj, punctconnie nsubjdecides ROOTto auxleave xcompon prepher possown pobj. punctdef get_entities(sent): """ extract the subject and the object (entities) from a sentence while also overcoming the challenges faced by spacy. Parameters ---------- sent: string Sentence to get entities for. Returns ------- List list containing subject and object. """ ## chunk 1 ent1 = "" ent2 = "" prv_tok_dep = "" # dependency tag of previous token in the sentence prv_tok_text = "" # previous token in the sentence prefix = "" modifier = "" for tok in nlp(sent): ## chunk 2 # if token is a punctuation mark then move on to the next token if tok.dep_ != "punct": # check: token is a compound word or not if tok.dep_ == "compound": prefix = tok.text # if the previous word was also a 'compound' then add the current word to it if prv_tok_dep == "compound": prefix = prv_tok_text + " " + tok.text # check: token is a modifier or not if tok.dep_.endswith("mod") == True: modifier = tok.text # if the previous word was also a 'compound' then add the current word to it if prv_tok_dep == "compound": modifier = prv_tok_text + " " + tok.text ## chunk 3 if tok.dep_.find("subj") == True: ent1 = modifier +" "+ prefix + " " + tok.text prefix = "" modifier = "" prv_tok_dep = "" prv_tok_text = "" ## chunk 4 if tok.dep_.find("obj") == True: ent2 = modifier + " " + prefix + " " + tok.text ## chunk 5 # update variables prv_tok_dep = tok.dep_ prv_tok_text = tok.text return [ent1.strip(), ent2.strip()]df['sentence'][5]"it's a parable of a woman's religious awakening—"get_entities(df['sentence'][5])['it', 'religious awakening']entity_pairs = []for i in tqdm(df["sentence"]): entity_pairs.append(get_entities(i))100%|██████████| 4318/4318 [00:38<00:00, 111.34it/s]def get_relation(sent): """ Get relation between sentence entities. Parameters ---------- sent: string Sentence to get relations for. Returns ------ string Relations in sent. """ doc = nlp(sent) # Matcher class object matcher = Matcher(nlp.vocab) #define the pattern pattern = [{'DEP':'ROOT'}, {'DEP':'prep','OP':"?"}, {'DEP':'agent','OP':"?"}, {'POS':'ADJ','OP':"?"}] matcher.add("matching_1", None, pattern) matches = matcher(doc) k = len(matches) - 1 span = doc[matches[k][1] : matches[k][2]] return(span.text)relations = [get_relation(i) for i in tqdm(df['sentence'])]100%|██████████| 4318/4318 [00:37<00:00, 115.69it/s]# building the graph# extract subjectsource = [i[0] for i in entity_pairs]# extract objecttarget = [i[1] for i in entity_pairs]kg_df = pd.DataFrame({'source' : source, 'target' : target, 'edge' : relations})kg_df| source | target | edge | |
|---|---|---|---|
| 0 | connie | own | decides |
| 1 | later woman | distance | heard in |
| 2 | christian | then elder | paralyzed by |
| 3 | temple | fire | set on |
| 4 | outside cult | him | wails with |
| ... | ... | ... | ... |
| 4313 | confidencial | negatively film | responded |
| 4314 | le parisien | five star rating | gave |
| 4315 | museum collection | 37,000 film titles | includes |
| 4316 | predecessor | historical film 1946 | was |
| 4317 | 1920'sfilmstar alexander binder | garbo by |
4318 rows × 3 columns
# create a directed-graph from a dataframegraph = nx.from_pandas_edgelist(kg_df, "source", "target", edge_attr=True, create_using=nx.MultiDiGraph())plt.figure(figsize=(12,12))pos = nx.spring_layout(graph)nx.draw(graph, with_labels=True, node_color='skyblue', edge_cmap=plt.cm.Blues, pos = pos)plt.show()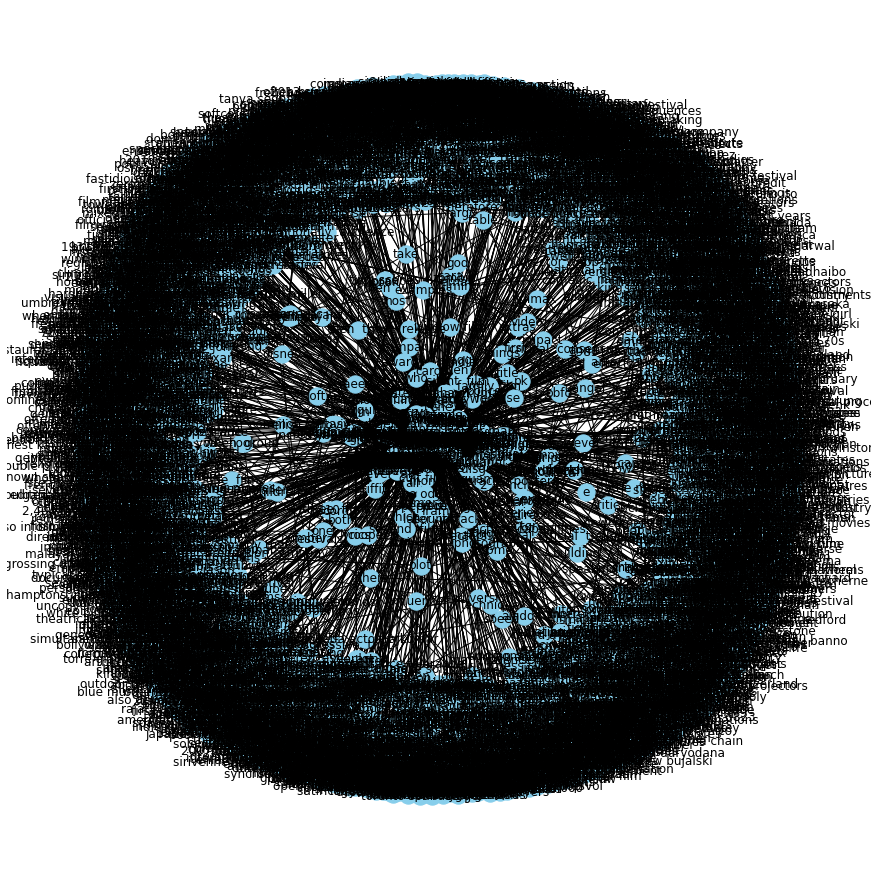
that took 2 minutes because there are a lot of relations to visualize, lets write a function to visualize a specific relation.
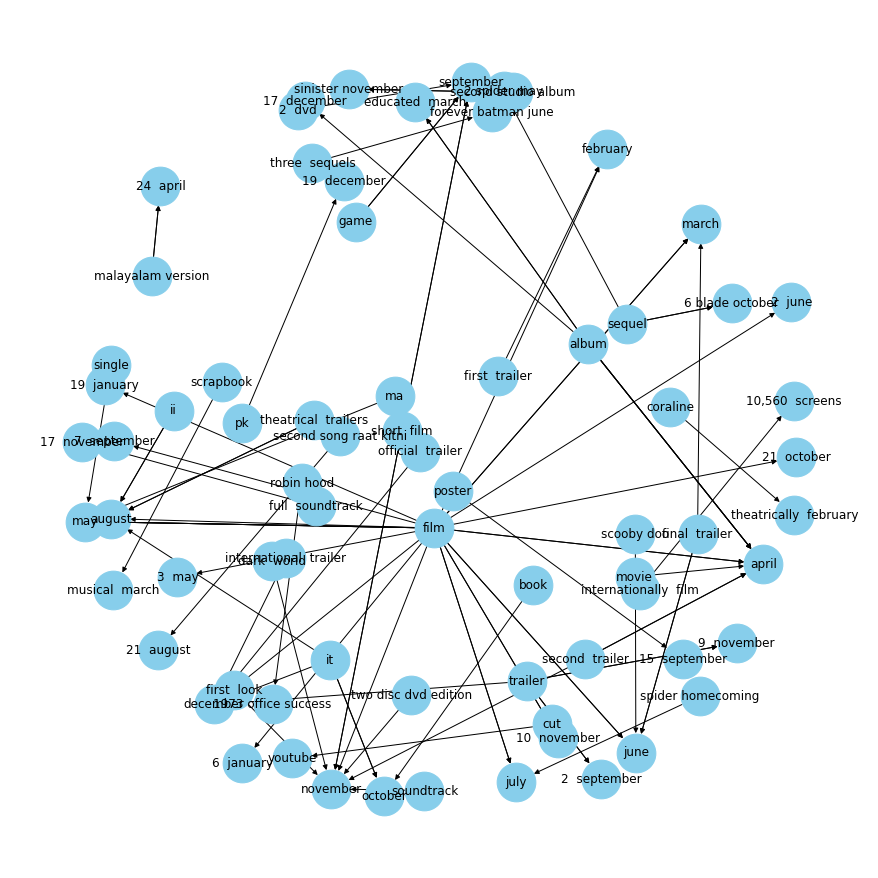
def plot_relation(relation): """ Plot relationship between entities given relationship. Parameters ---------- relation: string The relationship to plot in kg_df. """ com_graph = nx.from_pandas_edgelist(kg_df[kg_df['edge']==relation], "source", "target", edge_attr=True, create_using=nx.MultiDiGraph()) plt.figure(figsize=(12,12)) pos = nx.spring_layout(com_graph, k = 0.5) # k regulates the distance between nodes nx.draw(com_graph, with_labels=True, node_color='skyblue', node_size=1500, edge_cmap=plt.cm.Blues, pos= pos) plt.show()# get most common relationskg_df['edge'].value_counts()[:20]is 370was 297released on 87include 73were 71are 71released 40's 38composed by 35have 31has 31became 31become 29released in 27included 26produced 22called 22considered 20made 20had 20Name: edge, dtype: int64# plot some specific relationsplot_relation("were")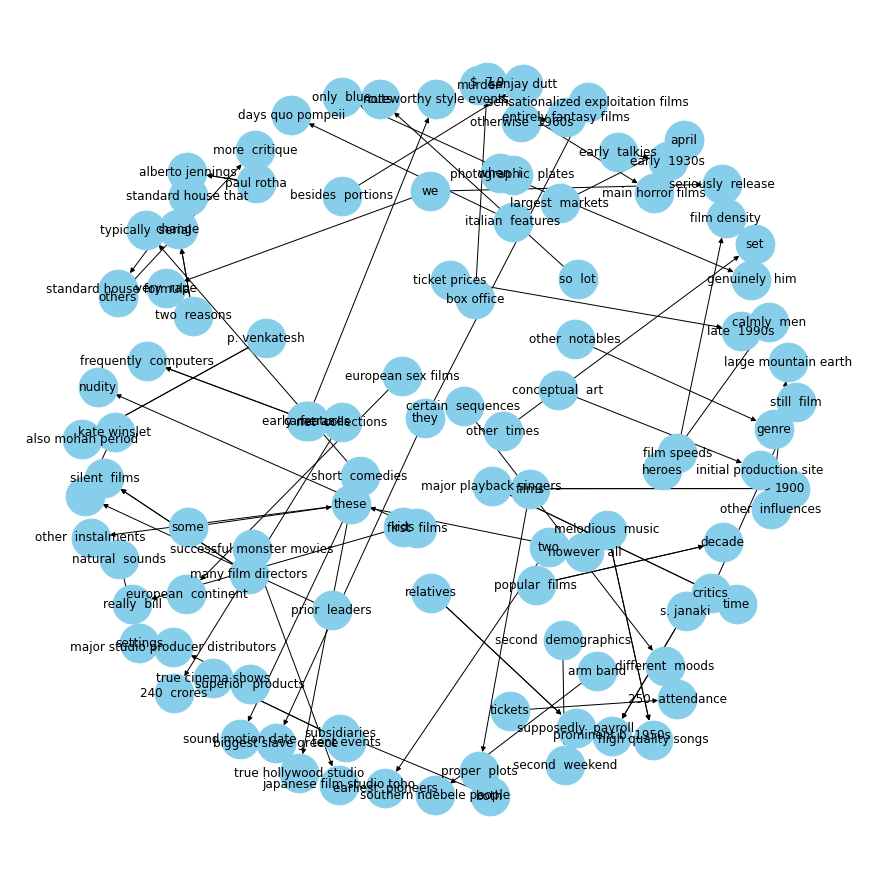
# plot some specific relationsplot_relation("had")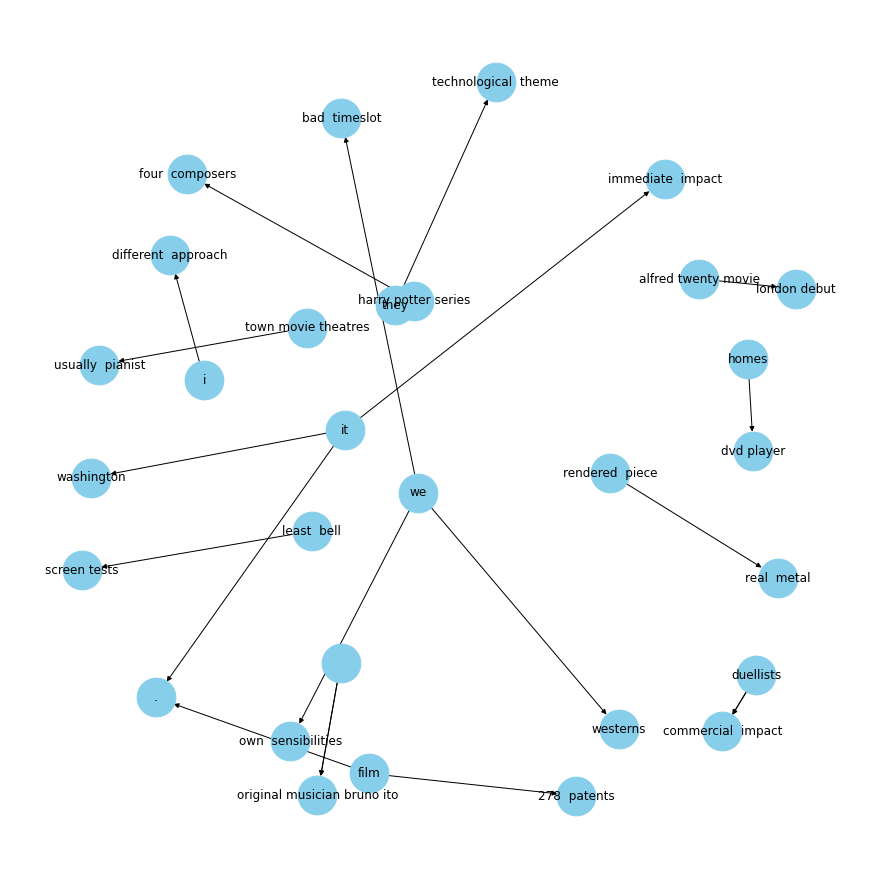
plot_relation("released in")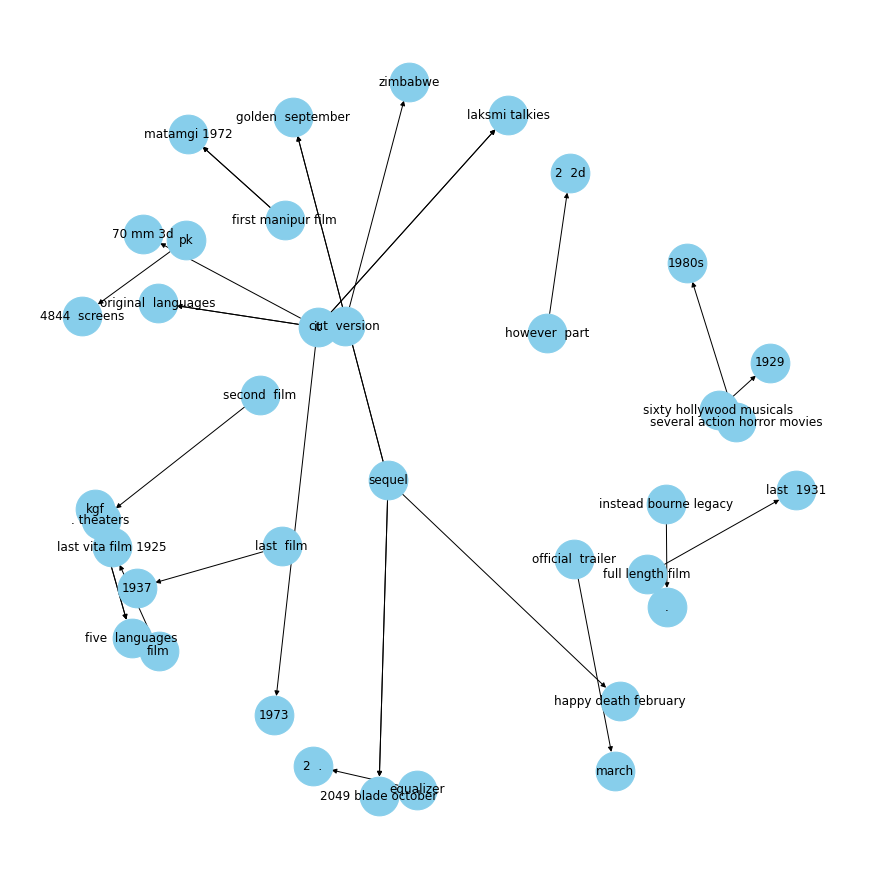
plot_relation("released on")